

Three Questions Every Export Boss Can't Answer
Chen runs a mechanical parts export company with 12 salespeople managing 30+ WhatsApp accounts. Thousands of messages flow daily — and he has no idea who's actually performing.
Last month he asked his sales lead: "How many new customers did we add this month?"
The answer: "Maybe… 50 or 60?"
Then: "What's the new customer reply rate?"
Silence.
Three questions keeping him up at night, none answerable:
- How many new customers are actually coming in? — Everyone looks busy, but new customer counts keep dropping
- Are the salespeople actually responding? — Some seem to type all day, but their reply rates don't match customer growth
- How much duplicate follow-up is happening? — Five people all contacting the same buyer in Saudi Arabia
This isn't a management experience problem — it's a tool problem. WhatsApp has no "team view." Every conversation is locked inside individual phones and computers.
The Data Dashboard: A Cockpit for Team Management
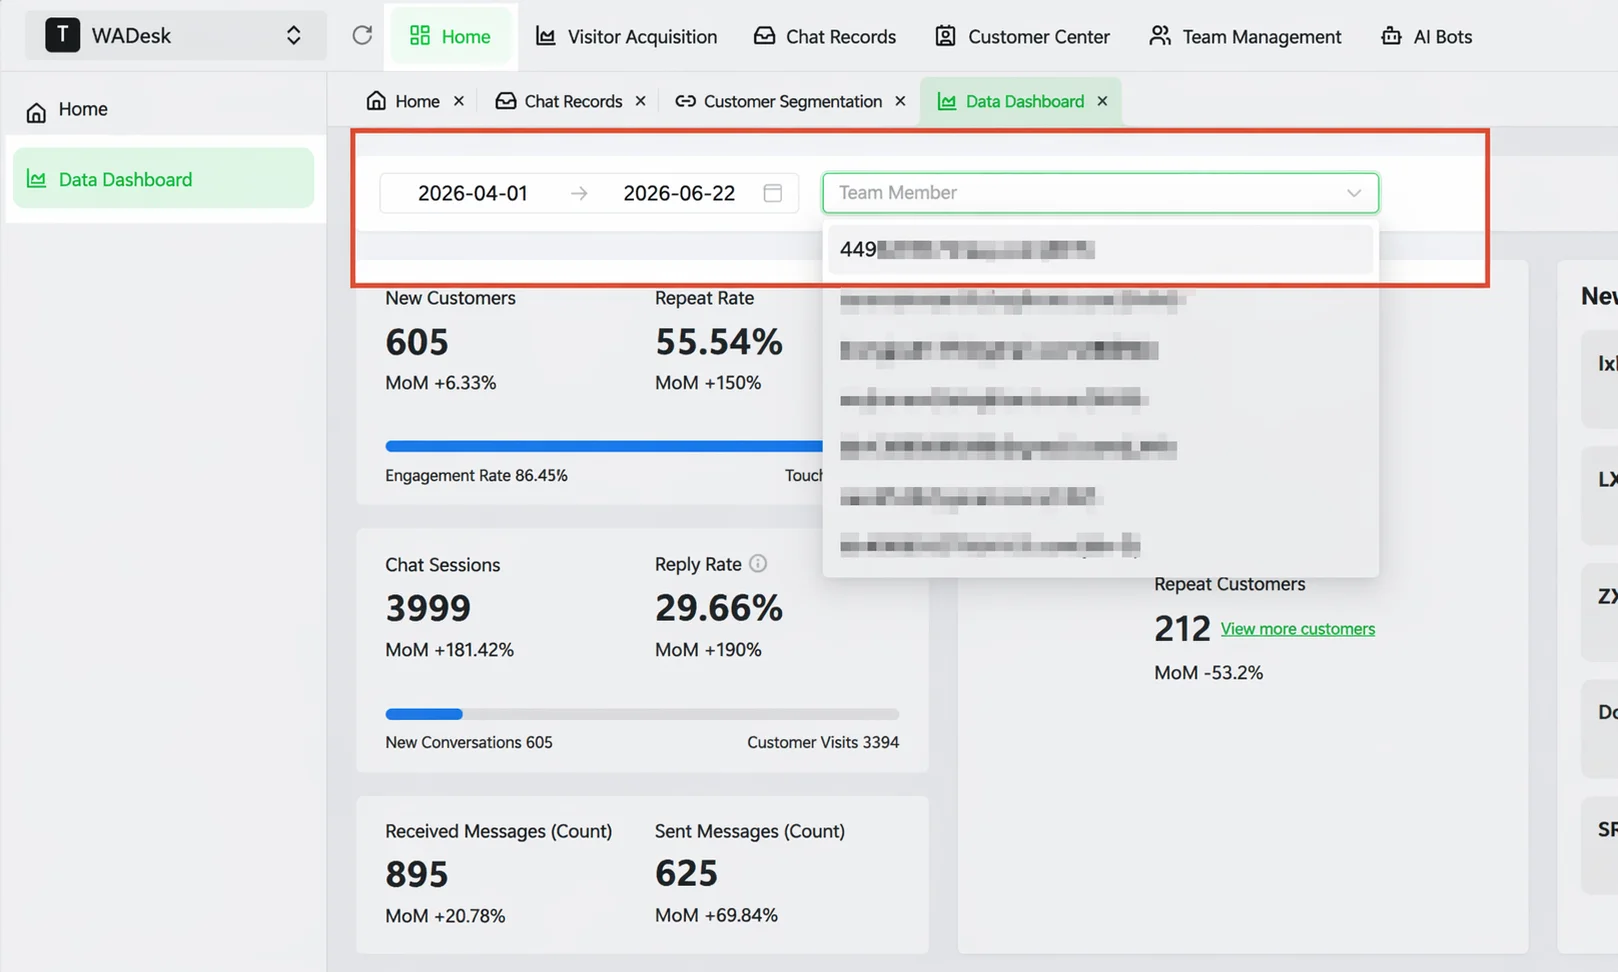
WADesk's data dashboard lives in the team dashboard (Web) and aggregates all key metrics in one place. Log in, and you see the full picture.
6 Core Metric Cards
| Metric | What It Shows | Why Leaders Care |
|---|---|---|
| New Customers | Contacts added in the selected period | Is growth healthy? |
| New Customer Reply Rate | % of new contacts who replied | Lead quality + follow-up effectiveness |
| Chat Sessions | Conversations initiated in the period | Customer engagement level |
| Chat Reply Rate | % of customer messages that received a sales response | Sales responsiveness |
| Messages Received | Total incoming messages from customers | Is customer demand rising? |
| Messages Sent | Total outgoing messages from sales | Is outreach active? |
These 6 metrics answer two fundamental questions: "Are customers coming in?" and "Is the team working?"
6 Trend Charts
Charts viewable by time range:
- Total customer count trend
- New customer trend
- Messages sent trend
- Messages received trend
- Online hours trend
- Average response time trend
The most valuable insight from trend charts isn't the absolute number — it's the direction. New customers declining for 3 consecutive days? Check your lead channels. Average response time suddenly spiking? A salesperson might be overloaded or offline.
Per-Member Comparison
The dashboard expands by team member. Every salesperson's data side by side — strengths and gaps are instantly visible.
At a glance:
- Salesperson A: 20 new customers → strongest at acquisition
- Salesperson B: 500 messages sent but only 30 replies → outreach efficiency issue
- Salesperson C: Shortest online hours but highest reply rate → high-efficiency performer
No need to read through individual chat histories — the data tells the story.
Duplicate Customer Detection: The Hidden Efficiency Drain
The most common blind spot in export team management is duplicate follow-up. Five salespeople sending separate quotes to the same buyer in Saudi Arabia — the customer gets annoyed, and company resources are wasted.
WADesk's dashboard detects duplicates in two dimensions:
- Team duplicate follow-up: Multiple members added the same customer independently
- Same customer, multiple accounts: One customer added through different WhatsApp accounts
Both types support drill-down — click to see exactly who's following which customer, then coordinate reassignment.
Based on observations from WADesk's work with export businesses, a mid-sized export team of 10 salespeople averages 15-30 duplicate follow-up events per month. Each duplicate means at least two salespeople occupying the same customer's time simultaneously. Eliminating duplicates typically improves team reply rates by 5-10%.
These are indicative estimates based on typical industry scenarios. Actual duplicate frequency varies by team size, management granularity, and lead assignment practices.
From Data to Action: A Dashboard Rhythm
An effective dashboard isn't decorative. Based on observations, most well-managed export teams follow a rhythm like this:
| Frequency | What to Check | What to Do |
|---|---|---|
| Daily (5 min) | New customers + chat reply rate | Flag anomalies, ask the right salesperson |
| Weekly (15 min) | 6 trend charts + member comparison | Identify declining metrics, plan improvements |
| Monthly (30 min) | Export data + duplicate analysis | Team review, adjust lead assignment strategy |
Data is exportable — download Excel by current filter for offline analysis.
FAQ
Is the data dashboard on the desktop client or web?
The data dashboard is only available on the team dashboard (Web). Desktop client does not include this feature. Access it by logging into wadesk.io workspace.
How often is data updated?
Data is updated in real-time. The dashboard shows the latest available data. Trend charts display daily data points with configurable time ranges.
Can I export the data?
Yes. Export to Excel format filtered by current criteria, including both per-member and per-day perspectives.
Can regular salespeople see the dashboard?
By default, the dashboard is designed for managers. Data visibility is controlled by role permissions — you can configure which team members have dashboard access.
Does duplicate detection interfere with normal follow-up?
No. Duplicate customer detection is a "notification-type" feature — it shows you which customers are being followed by multiple people. The manager decides whether to reassign. It does not interrupt sales follow-up.